

How to Do Technical Analysis
In short: Technical analysis studies past price and trading volume to understand how a stock has been moving. It uses trends, support and resistance, chart patterns and indicators such as RSI and moving averages. It shows what has happened, not what a company is worth.
Before you invest in a stock, there is a lot to consider, including the company’s fundamentals and finances. Technical analysis adds another view: how the share price has moved over time.
This beginner’s guide explains what technical analysis is and how it works.
It covers four basics:
Understanding Chart trends
Support and resistance price action
Types of Chart Patterns
Technical chart indicators
What is technical analysis?
Technical analysis studies past price and trading volume to understand how a stock has been moving. Technical analysts look for trends and patterns in charts.
They look at price trends, momentum and trading volume. Ratios such as P/E belong to fundamental analysis instead. Some people use one or two indicators; others combine many into a set of rules.
No method predicts prices reliably, and results vary a lot from person to person.
Why use technical analysis?
Fundamental analysis looks at the business itself: sales, profits, debt and its industry. That tells you about value, but not how the price may move in the short term.
Technical analysis focuses on the price itself. It assumes that trends tend to continue until something changes them.
It does not tell you whether a stock is undervalued. For that, you need fundamental analysis or a valuation method such as our free fair value calculator.
Here are the basics.
Understanding chart trends
Chart trends are price moves that are a longer-term expression of an underlying sentiment or thought process. Charts reflect activity over a certain period, which is why they are so important when trying to understand stock movements in comparison with historical data. In a sense, a chart shows how buyers and sellers have been behaving.
If a chart is trending downward for an extended period of time, it’s showing that more people have been selling than buying on average over time. Conversely, if a chart is trending upward for an extended period of time, it’s showing that more people have been buying than selling on average over time.
Support and resistance price action
What is support and resistance price action? Support and resistance are two of the most important concepts in technical analysis. They can take beginners a while to understand.
The images below explain them visually.
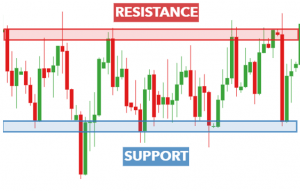
Support is a price level where buying has tended to stop a fall. When the price reaches it, buyers have often stepped in before.
Resistance is a price level where selling has tended to stop a rise. When the price reaches it, sellers have often stepped in before.
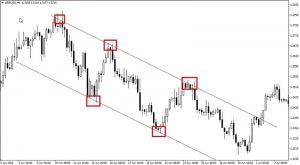
Support and resistance don’t have to be flat lines. They can also be sloping trend lines. Levels can break, so they are a guide, not a rule.
Types of chart patterns
Chart patterns are divided into two categories: reversal and continuation. Reversal patterns suggest a trend may be ending. Continuation patterns suggest it may carry on after a pause.
Examples of chart patterns include
Rounded tops/ bottoms
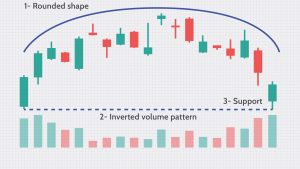
A rounded bottom looks like a “U”; a rounded top looks like an upside-down “U”.
Head-and-shoulders
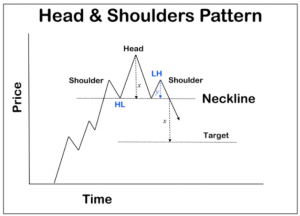
Three peaks, where the middle one is highest and the two outside peaks are about the same height.
Double top/bottoms
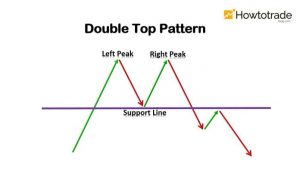
A reversal pattern where the price hits roughly the same high (or low) twice, with a pullback in between.
Triangles
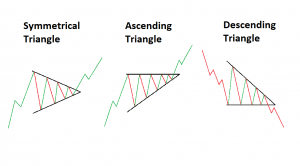
Formed when price swings get narrower between two converging trend lines.
Flags
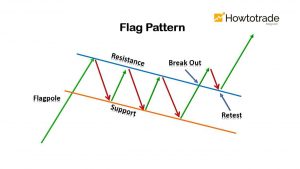
A short pause in a small sloping channel after a sharp move, usually treated as a continuation pattern.
Pennants
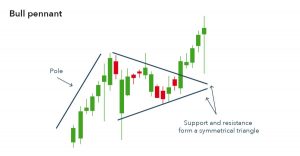
A small triangle that forms after a sharp move, also usually treated as a continuation pattern.
Patterns describe what often happened in the past. They fail often, so they are never a guarantee of what comes next.
No single method predicts prices reliably. Many people combine several tools, and test their rules on past data before trusting them.
Technical chart indicators
Technical indicators are calculations based on price or volume, shown on or under a chart. The most common are:
RSI (relative strength index)
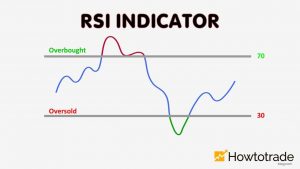
A momentum indicator that measures the size of recent price changes, often used to spot overbought or oversold conditions.
Stochastic oscillator
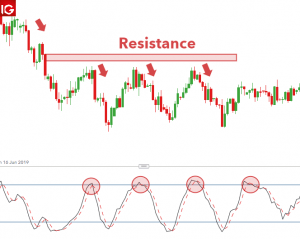
A momentum indicator that compares the latest closing price with the high-low range over a set period.
Moving average
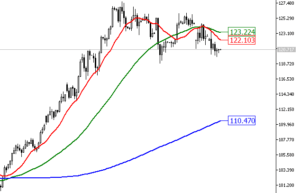
The average price over a set number of days, which smooths out day-to-day noise.
Volume
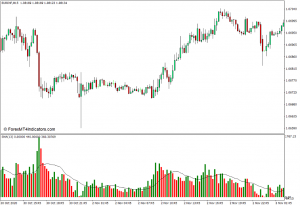
The number of shares traded in a given period. Big price moves on high volume are usually taken more seriously.
These indicators look intimidating at first, but they are simpler than they seem. Turning them into clear rules and testing those rules on past data is exactly what we teach in Algorithmic Research 101.
Browse topics
Value a CSE stock in under a minute
Free fair value calculator for 290+ CSE companies. DCF, P/E and NAV, with the method picked for each sector.
Open the calculator →