How to do the Technical Analysis
Before you decide to invest in any particular stock, there are many things to consider. Including the fundamentals of the company and their current financial standing. However, one of the most important aspects to look at when investing in stocks is technical analysis. Whether you’re an expert or just starting out. It’s important to know how the stock price has moved over time.
This is where technical analysis comes into play. Learn more about what technical analysis is and how it can be used. This inform your investment strategy in this beginner’s guide to technical analysis.
Below are some basic steps in technical analysis,
-
Understanding Chart trends
-
Support and resistance price action
-
Types of Chart Patterns
-
Technical chart indicators
What is Technical Analysis?
Technical analysis is a way of forecasting what’s going to happen in the stock market. Technical analysts watch for patterns in charts and then use that data to make predictions about what’s going to happen next.
A technical analyst will look at past performance, momentum, supply and demand, trading volume, price-to-earnings ratios, current ratio etc. The number of factors used can be as simple as just one or two indicators or be as complex as dozens of indicators combined into a trading system.
Some technical analysts are able to look at past performance and make accurate predictions while others are not so good at it.
Why Use Technical Analysis?
Fundamental analysis relies on data relating to a particular company and its industry, including sales figures, supply chain information, and investor sentiment. That’s all important stuff—but it doesn’t necessarily tell you what a stock is going to do in the short term.
In contrast, technical analysis aims to determine whether an asset is cheap or expensive based on past performance. It assumes that trends will continue into the future so long as there are no new fundamental developments that would change those trends.
When used correctly (which we’ll get into below), technical analysis can be very effective at identifying undervalued stocks and preventing you from overpaying for ones that have already gone up in value.
Below are some basic guidelines in technical analysis,
Understanding Chart trends
Chart trends are price moves that are a longer-term expression of an underlying sentiment or thought process. Charts reflect activity over a certain period, which is why they are so important when trying to understand stock movements in comparison with historical data. Essentially, it’s one way to keep track of what people are doing and feeling, and how their actions lead them to take positions.
If a chart is trending downward for an extended period of time, it’s showing that more people have been selling than buying on average over time. Conversely, if a chart is trending upward for an extended period of time, it’s showing that more people have been buying than selling on average over time.
Support and resistance price action
What is support and resistance price action? Support and resistance are two of the most important concepts in technical analysis. They are also some of most difficult concepts for beginner traders to understand.
The below images will explain support and resistance using simple language, visualizations.
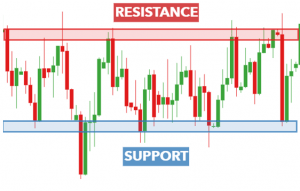
Support is the region where buyers show their strong entry. When market hits support level we can expect the strong entry of buyers to push the price to go up.
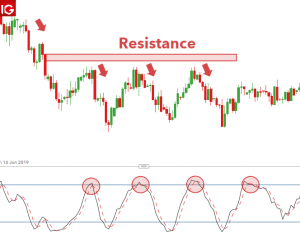
Resistance is the region where sellers show their strong entry. When market hits resistance level we can expect the strong entry of sellers to push the price to go down.
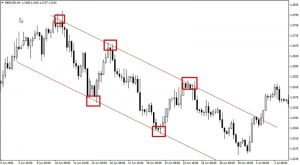
Support and resistance not always needs to be a horizontal area. It can be a trend line too. The idea here is the price line which buyers’ entry is support and sellers’ entry is resistance.
Types of Chart Patterns
Chart patterns are divided into two categories: reversal and continuation. Reversal patterns signify that a stock has run out of steam and it’s time for a correction. Continuation patterns show that an existing trend is likely to continue.
Examples of chart patterns include
- Rounded tops/ bottoms
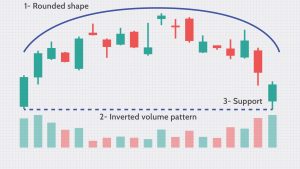
Rounded pattern when graphed form the shape of an “U.”
- Head-and-shoulders
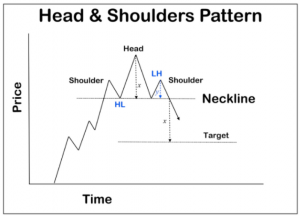
This form from baseline with three peaks, where the outside two are close in height and the middle is highest
- Double top/bottoms
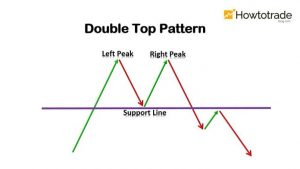
These are extremely technical reversal pattern that forms after an asset reaches a the price baseline two consecutive times with a moderate decline between the two highs
- Triangles
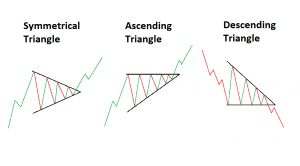
Triangle pattern form by drawing price action trend lines along with the momentum forms a triangle pattern
- Flags
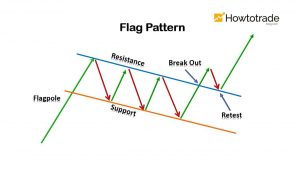
A flag pattern forms after a strong trend pattern signify trend reversals or breakouts after a period of consolidation
- Pennants
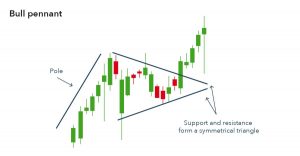
A Pennant pattern is special type of triangle pattern form by a continuation chart pattern, seen when a large upward or downward movement, followed by a small consolidation, before continuing to move in the same direction.
The main concept is if these kinds of patters appear in a market. Then there is a huge change of the market will follow the logic which associated with the pattern. It not always a rule but it’s a main confirmation to take a trade confidently.
The size of chart patterns depends on time frame and market capitalization. Investors look at technical analysis as a tool rather than following any one approach religiously because no single method will accurately predict future prices 100% of the time. Using several methods simultaneously improves odds by looking at them together rather than as stand-alone factors. By keeping them consistent with each other by using technical indicators helps filter what might otherwise appear random price movements and increases accuracy over short periods like weeks or months.
( If you wish to Watch a cool video explaining this topic – CLICK HERE )
Technical chart indicators
Watching stocks and buying or selling a stock based on charting indicator data is called technical analysis indicators. However, many investors are confused about how indicators work. For example, when analyzing a stock chart, investors often use these indicators.
- RSI (relative strength index)
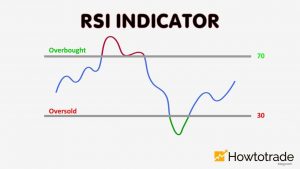
The Relative Strength Index (RSI) is a momentum indicator. That shows the magnitude of recent price changes to analyze overbought or oversold conditions
- Stochastic oscillator
The stochastic oscillator is a momentum indicator that uses support and resistance levels. The stochastic oscillator compares the most recent closing price to the range for a given period.
- Moving average
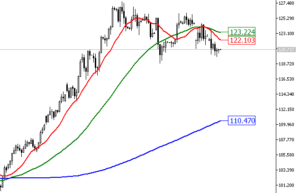
A moving average is a technical analysis indicator. That helps smooth out price action by filtering out the “noise” from random price fluctuations.
- Volume
The volume of trade refers to the total number of shares or units exchanged between buyers and sellers of a trade instrument during trading hours on a given period of time.
Familiarizing with these indicators can be intimidating at first but don’t worry in reality, these indicators are simpler than they seem. Once you started using these indicators you can get good knowledge on how to analyze them precisely.